
Why I Am Not a Fan of R-Squared

The core view of this post is translated from John Myles White's article. Why I'm Not a Fan of R-Squared
The questions in this article can also be addressedStatistics and Truth: How to use the accident (Statistics and Truth)、Anscom Quartet: Visualized power and statistical illusionHow the concept of a relatively close read together is developed in different contexts.
Take Home Message
$R^2$ Not simply model error functions, but it also implies a comparison of two models: One is the model currently analysed, and one is the so-called constant model (i.e., the model that only uses the average of variables to predict). The blogger says:$R^2$ The answer is one question:
"Is my model better than a constant model?"
But we usually want to answer another completely different question:
"Is my model worse than the real model?"
The case of some people who have been constructed shows that the answers to the two questions are not interchangeable. One example can be constructed: our models are not much better than constant models, nor are they much worse than real models. Similarly, another example can be constructed that makes our models far better than constant models, but far worse than real models.
The way the model compares with all the models,$R^2$ Not only is it a function of a comparable model, it is also a function of observational data.I'm sorry. Almost all models have a data set that makes it impossible to distinguish between constant models and real models. Specifically, when using a model to distinguish between data sets that are less effective,$R^2$ It can be anywhere near zero -- even if we calculate the real model. $R^2$ The same goes for me.
We must therefore always remember:
$R^2$ It's not like we're talking about models that are a good approximation of real models.$R^2$ Just tell us if our models are much better under current data than a constant model.
A theoretical example
To understand how “comparison of models with constant models” leads to a conclusion that is distinct from “comparison of models with real models”, a simple example is considered: we want to compare functions. $f(x)$ Modelling and $n$ Noise-bearing data were observed at the point of the equation.
First, it is assumed that:
- $f(x) = \log(x)$。
- $x_{min} = 0.99$。
- $x_{max} = 1.01$。
- Yes. $x_{min}$ and $x_{max}$ We've seen 1,000 points of even distribution. $y_i = f(x_i) + \epsilon_i$, of which $\epsilon_i \sim \mathbf{N}(0, \sigma^2)$。
Based on these data, we try to use single variables, OLS, to learn from it. $f(x)$ and a secondary model. An example of the modelling process is as follows:
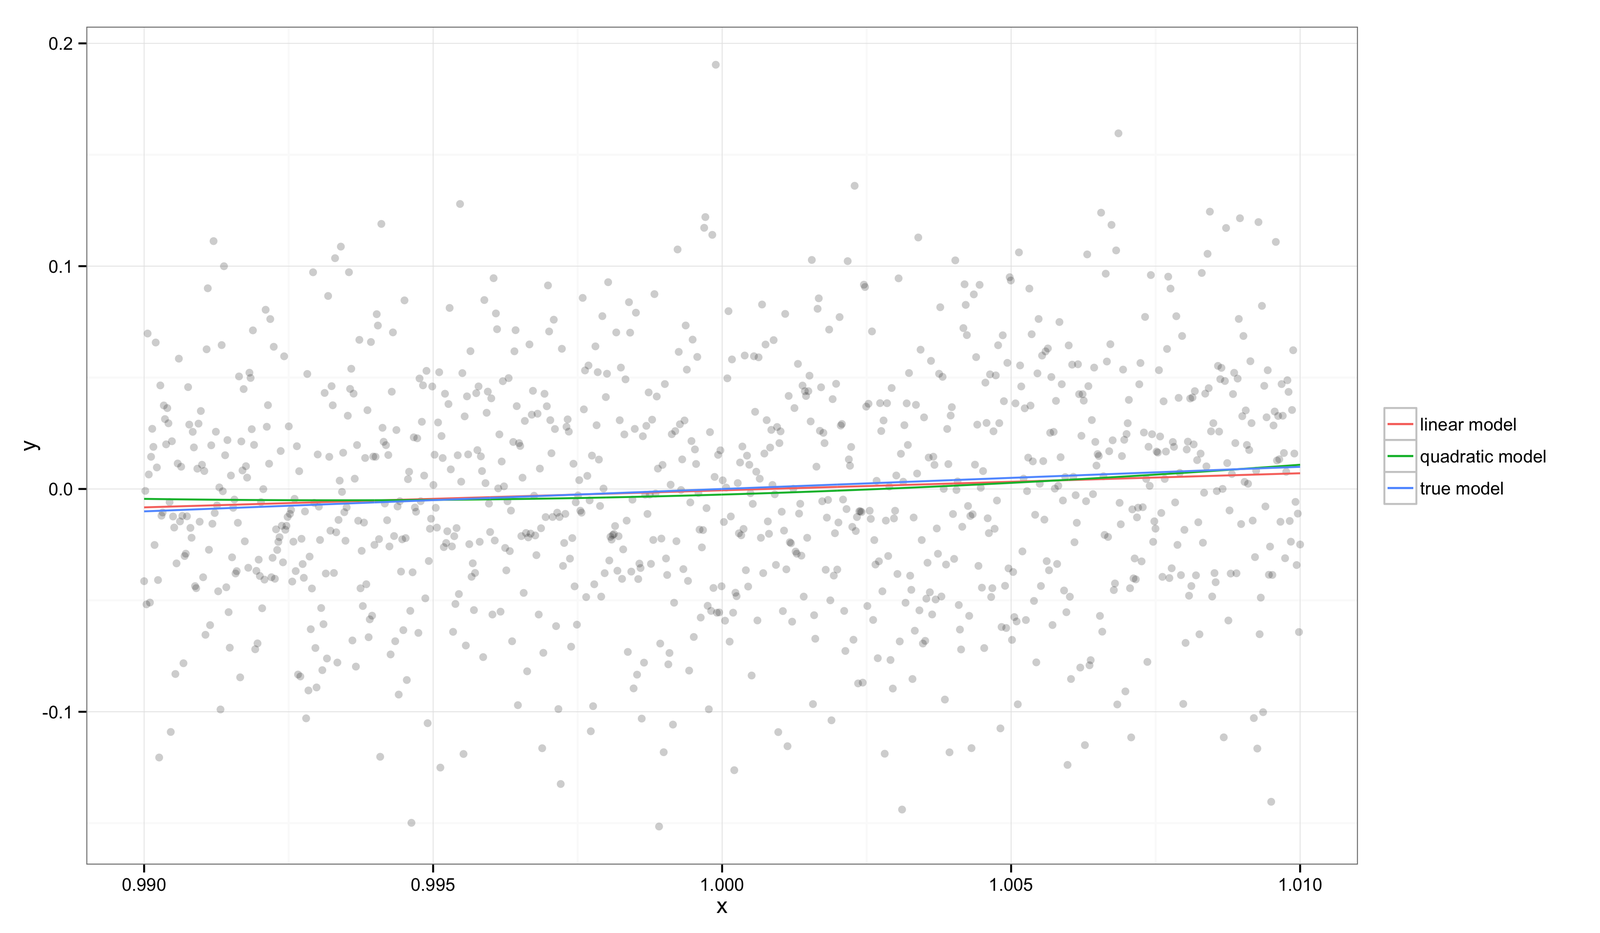
In this picture,$f(x)$ It can be well approximated by a straight line, so both linear and secondary regression models are fairly close to real models. It's because... $x_{min}$ and $x_{max}$ Very close, the target function can be approximated in this area, especially when considering the level of noise observed.
If you calculate these models, $R^2$It'll find a linear model. $R^2 = 0.007$It's a real model. $R^2 = 0.006$I'm sorry. This is a very low value, suggesting that our model is no better than that of constant, although it is already the best linear approximation in this local area.
$R^2$The reason for this is that constant models are already good at this time; because the differences are large, they are difficult to match with the noise.
Now, if $x_{max}$ and $x_{min}$ What happens when the gap gets bigger? For like $f(x) = \log(x)$ This is a monotonous function. $R^2$ There's gonna be a strange change.
And then look at a specific example of it. $x_{min} = 1$ and $x_{max} = 1000$:
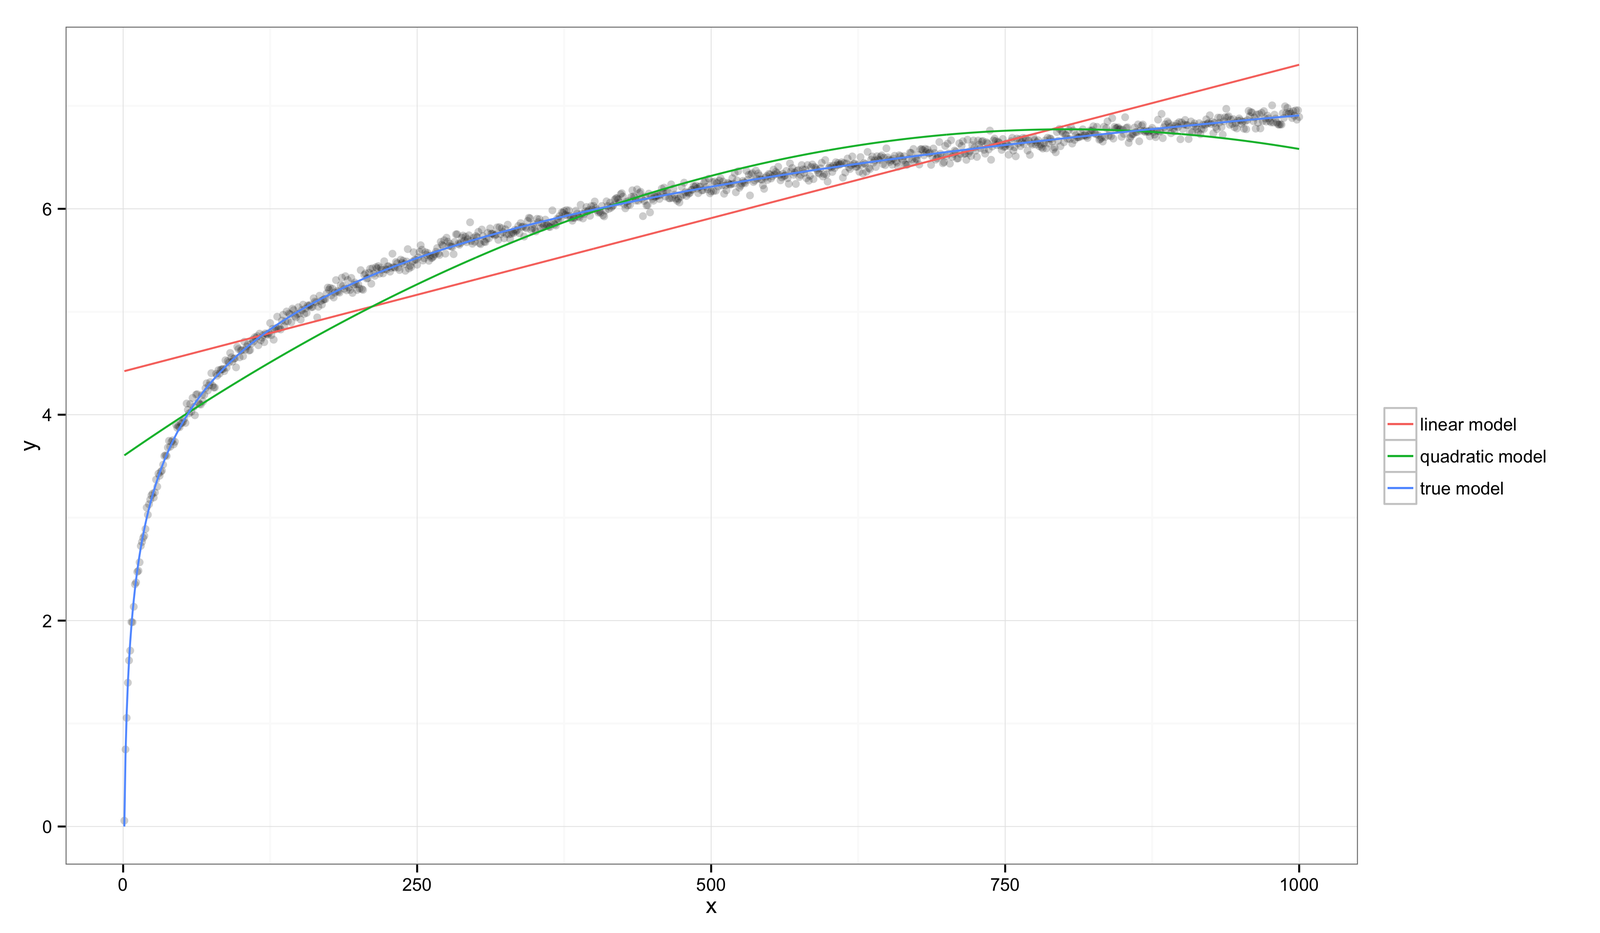
In this case, it is clear from visual examination that both linear and secondary models are systematically inaccurate (because the logarithmic functions are clearly not linear), but they are. $R^2$ And the value went up dramatically: linear models. $R^2 = 0.760$It's a real model. $R^2 = 0.997$。
These examples show that even most people agree that linear models are becoming a near-feature of the real models (i.e., increasingly systemic deviations) and linear models. $R^2$ The government has been able to increase the number of people in the country. This means that,$R^2$ It could be misleading.
Conclusions
These are not content that can be stopped by users. $R^2$, but use the following premise to fully understand:
- $R^2$ The value of the data set used depends to a large extent on the value used;
- Even if your model is becoming a growing approximation of the real model,$R^2$ The value may also decline (and vice versa).
When deciding whether a model is useful, it's high. $R^2$ Not necessarily. Low. $R^2$ It is not necessarily undesirable.
It is an inescapable question: whether a misdeed model is useful is always dependent on the area where the model is applied and on the way we assess all possible errors in that area. Because... $R^2$ It contains an implicit model comparison, which is subject to this general dependence on data sets.
In contrast, proposed convergence indicators such as MSE (average error) and MD (average absolute deviation) are not the only ones that are not the most important.Its “defect” is also its advantage.I'm sorry. They lack implicit homogenization and are ostensibly “arbitrary numbers” that are totally affected by the field. This characteristic forces analysts to face up to the sensitivity of the indicators to the application field — compared to the fact that the data are not available in the country.$R^2$ The integration of these figures makes them less arbitrary and may also make it seem that model assessments of data dependency are not easy, so that the high R side is blindly perceived as good.
- Title: Why I Am Not a Fan of R-Squared
- Author: Hyacehila
- Created at : 2026-02-08 04:00:00
- Link: https://hyacehila.github.io//blog/2026/02/08/why-im-not-a-fan-of-r-squared/
- License: This work is licensed under CC BY-NC-SA 4.0.