
Does a 30/30/30+10 Portfolio Really Diversify China A-Shares?

I recently wanted to test a very intuitive portfolio: hold the CSI 300, CSI A500, and CSI 1000 in equal proportions. If I wanted to leave a little room outside the core, I could reduce each to 30% and put the remaining 10% in cash, renminbi gold, or the STAR 50. It seems to combine large caps, representative companies across industries, and small-cap growth. The rule is also simple enough to implement with the relevant funds, even without an exchange-traded account.
Rebalancing frequency was the question I first wanted to investigate. Once I began, however, a more basic question appeared: what do these three names actually buy when they are placed together?
The CSI A500 is not “the 500 companies between the CSI 300 and CSI 1000.” That position is closer to the CSI 500. The CSI A500 selects relatively large and liquid representative securities across industries, so it repeatedly owns many of the same large companies as the CSI 300. The CSI 1000 supplies the clearer small-cap allocation.
What am I buying when I build this portfolio? What return and risk does it carry, and what does rebalancing change? Those are the questions this post tries to answer.
A nearly fully invested A-share portfolio cannot escape the market’s aggregate risk. Maximum drawdowns are around 70% across the rules. Quarterly and threshold rebalancing each have practical advantages, but neither leaves the alternatives far behind statistically. The 10% satellites create more visible differences. Since 2020, cash has reduced volatility and drawdown at the cost of some return. Gold is the only satellite in this sample to improve return, volatility, and drawdown at the same time, although a simpler 90% CSI All Share plus 10% gold benchmark does at least as well. The STAR 50 behaves more like an aggressive growth tilt. A rule that progressively spends cash after drawdowns does not control risk here; it deepens the drawdown.
This is a personal backtest for reference only, not investment advice.
Three indices are not three disjoint baskets
The CSI A500 factsheet defines it as 500 relatively large and liquid representative securities selected across industries, emphasizing sector representation. The CSI 500 is a size index and forms a more direct market-cap ladder with the CSI 300 and CSI 1000. Both happen to contain 500 constituents, but they are designed for different purposes.
As of July 31, 2026, the count-based Jaccard overlap between the CSI 300 and CSI A500 is 42.10%, while their weighted overlap reaches 78.68%. The CSI A500 and CSI 500 have a 24.38% count overlap but only 16.57% weighted overlap. The weighted overlap between the CSI A500 and CSI 1000 is lower still, at 1.64%. The CSI A500 broadens coverage, but most of its weight remains on the CSI 300 side of the market.
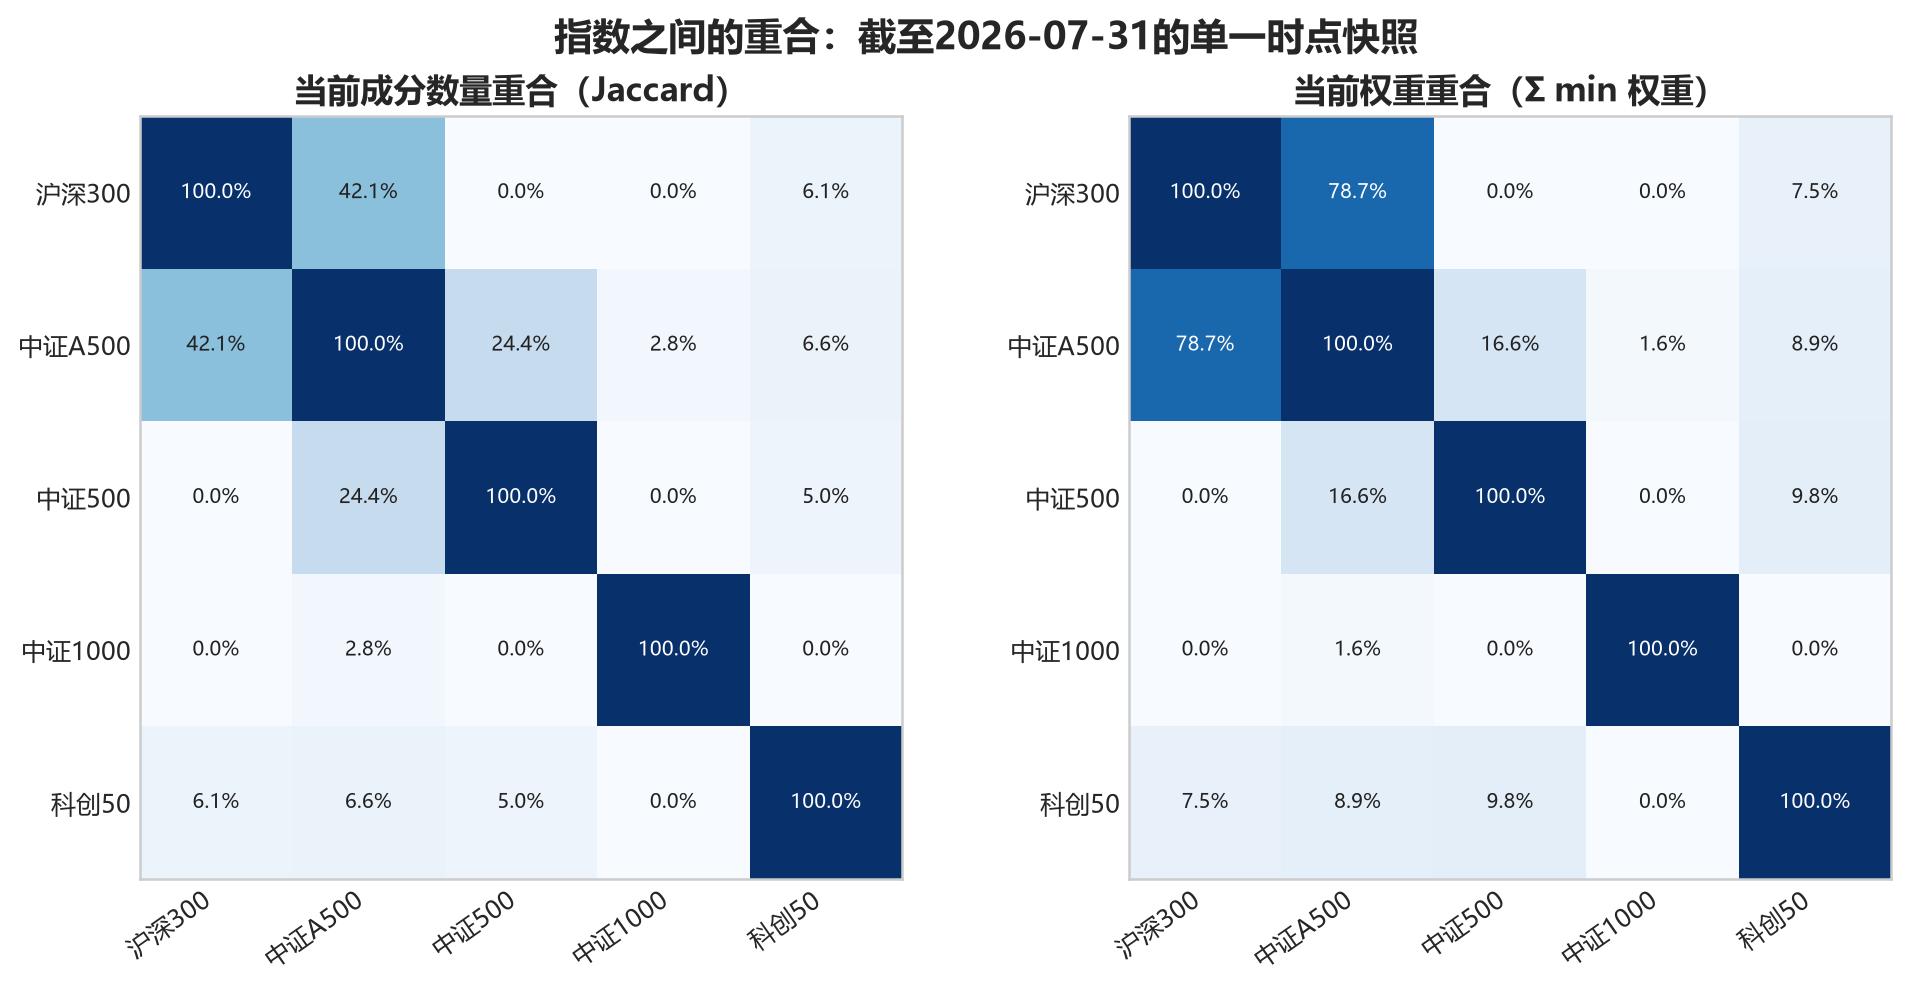
Overlap uses only the official July 31, 2026 constituent snapshot. Published weights are rounded to three decimal places and are normalized to 100% before calculation.
Looking through the three indices turns 1,800 nominal slots into 1,522 distinct stocks. Of those, 278 occur in two indices. The top ten account for 14.91%, and the effective number of holdings is about 243. CATL, Zhongji Innolight, Kweichow Moutai, Ping An, Eoptolink, and Zijin Mining all receive weight from both the CSI 300 and CSI A500.
The industry distribution is just as revealing. Industrials account for about 22.17%, information technology for 21.97%, and financials for 11.50%. There are many stocks, but the weights still cluster around a few sectors and shared market leaders.
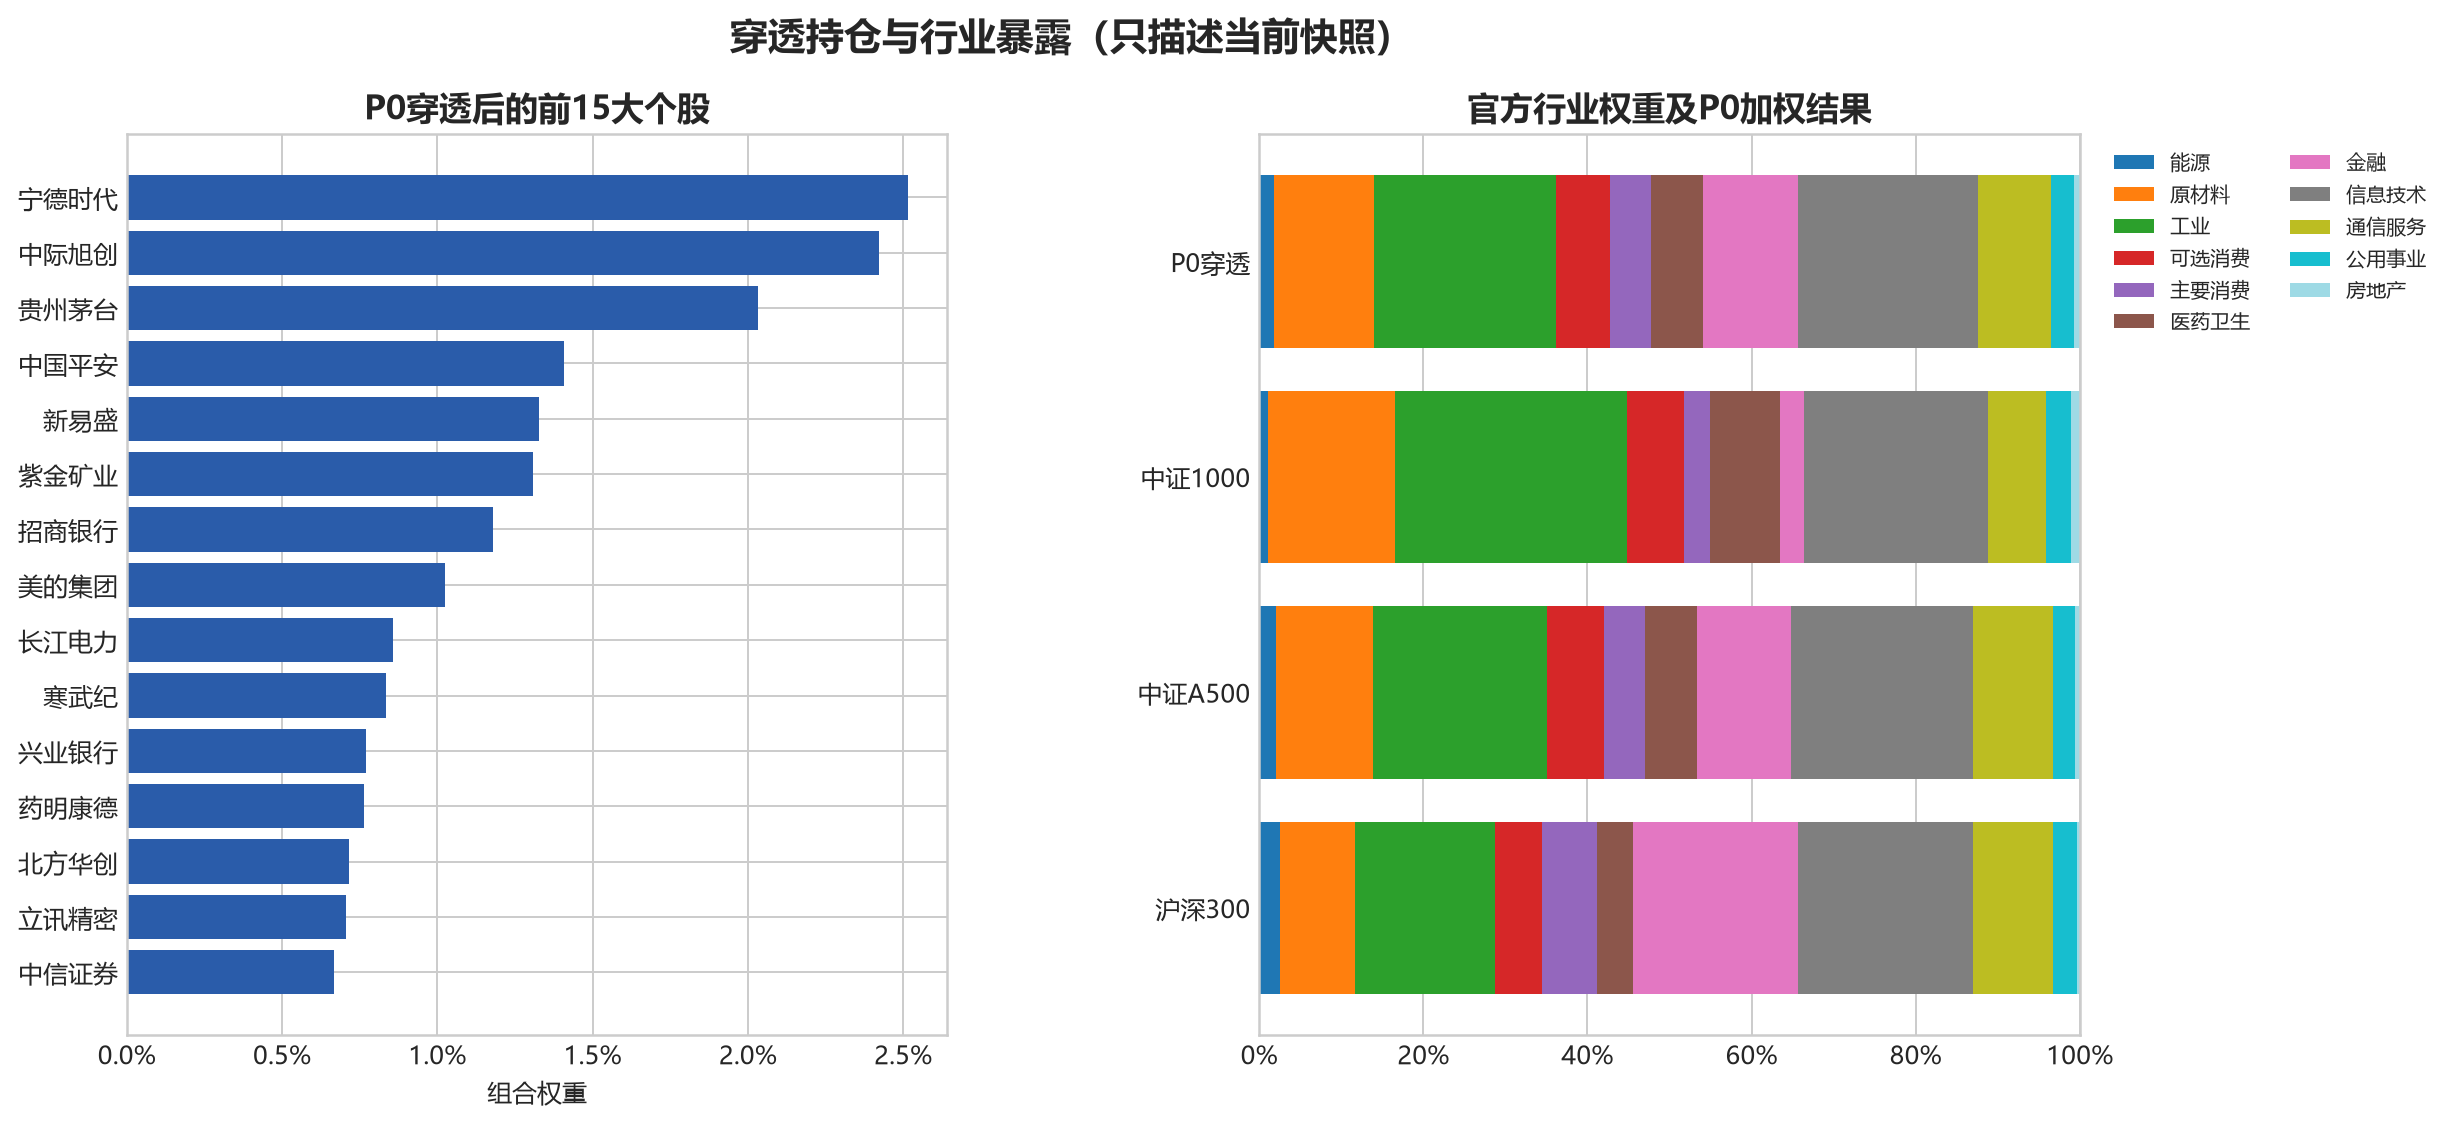
The left panel shows P0’s top 15 look-through holdings. The right panel compares only the CSI 300, CSI A500, CSI 1000, and the weighted P0 result. The CSI 500 and STAR 50 are not in this figure.
This does not mean the portfolio has no diversification. It is broader than the CSI 300 alone, and the CSI 1000 adds genuine small-cap exposure. It still does not create independent risk sources. A CSI 300/CSI 500/CSI 1000 mix is closer to a clean large/mid/small-cap segmentation. The CSI A500 is the structural choice when the goal is to add industry representation within the large-company allocation. I compare the two structures later in the article.
The long-run theoretical layer uses official total-return indices. H11025, the CSI Money Market Fund Index, is the cash proxy, while renminbi gold uses the Shanghai Gold Exchange Au99.99 close. The CSI A500 was not launched until September 23, 2024, so most of its history here is a rules-based backcast. The new background boards use the same official total-return convention: H00922 for the CSI Dividend Index and 932000CNY010 for the CSI 2000. The CSI 300 continues to use the previously frozen H00300 series and was not downloaded again.
Portfolio rules
There are five principal portfolios:
| ID | Target allocation | Role |
|---|---|---|
| P0 | 33.33% each in CSI 300/CSI A500/CSI 1000 | Three-index CSI A500 core |
| P1 | 30% each in the P0 indices plus 10% cash | Defensive satellite |
| P2 | 30% each in the P0 indices plus 10% renminbi gold | Diversifying satellite |
| P3 | 30% each in the P0 indices plus 10% STAR 50 | Aggressive satellite |
| S0 | 33.33% each in CSI 300/CSI 500/CSI 1000 | Size-segment control |
P0 through P3 run six rules: buy and hold, monthly, quarterly, annual, daily threshold checks, and month-end threshold checks. Calendar signals are generated at month-, quarter-, or year-end close and executed at the next common trading-day close. Threshold signals use the same T+1 timing. Information observed after the trigger-day close cannot be traded at that same close.
The main threshold is reached when any asset deviates from its target by
The entire portfolio then returns to target. The narrow and wide settings are 3 percentage points/15% and 7 percentage points/35%.
The theoretical main result charges 10 bp per side and also checks 0, 5, and 20 bp. Costs are applied to actual traded weight on each asset leg. Risk ETFs use 5 bp per side and 511990 uses 2 bp per side:
This assumption is somewhat higher than my actual trading cost. As the results show, costs at these levels barely change this low-turnover strategy.
What rebalancing buys over the long sample
P0 begins at the December 31, 2004 index base date. Its six rules produce the following results:
| Rule | CAGR | Annual volatility | Max drawdown | Calmar | Annual rebalance turnover | 95% weight drift |
|---|---|---|---|---|---|---|
| Buy and hold | 10.11% | 25.67% | -71.35% | 0.142 | 0.00% | 18.19% |
| Monthly | 10.54% | 25.37% | -71.22% | 0.148 | 22.92% | 1.77% |
| Quarterly | 10.53% | 25.37% | -71.31% | 0.148 | 12.32% | 3.15% |
| Annual | 10.56% | 25.42% | -71.39% | 0.148 | 7.21% | 6.37% |
| Daily threshold check | 10.62% | 25.38% | -71.19% | 0.149 | 8.12% | 3.85% |
| Month-end threshold check | 10.60% | 25.39% | -71.38% | 0.148 | 6.65% | 4.48% |
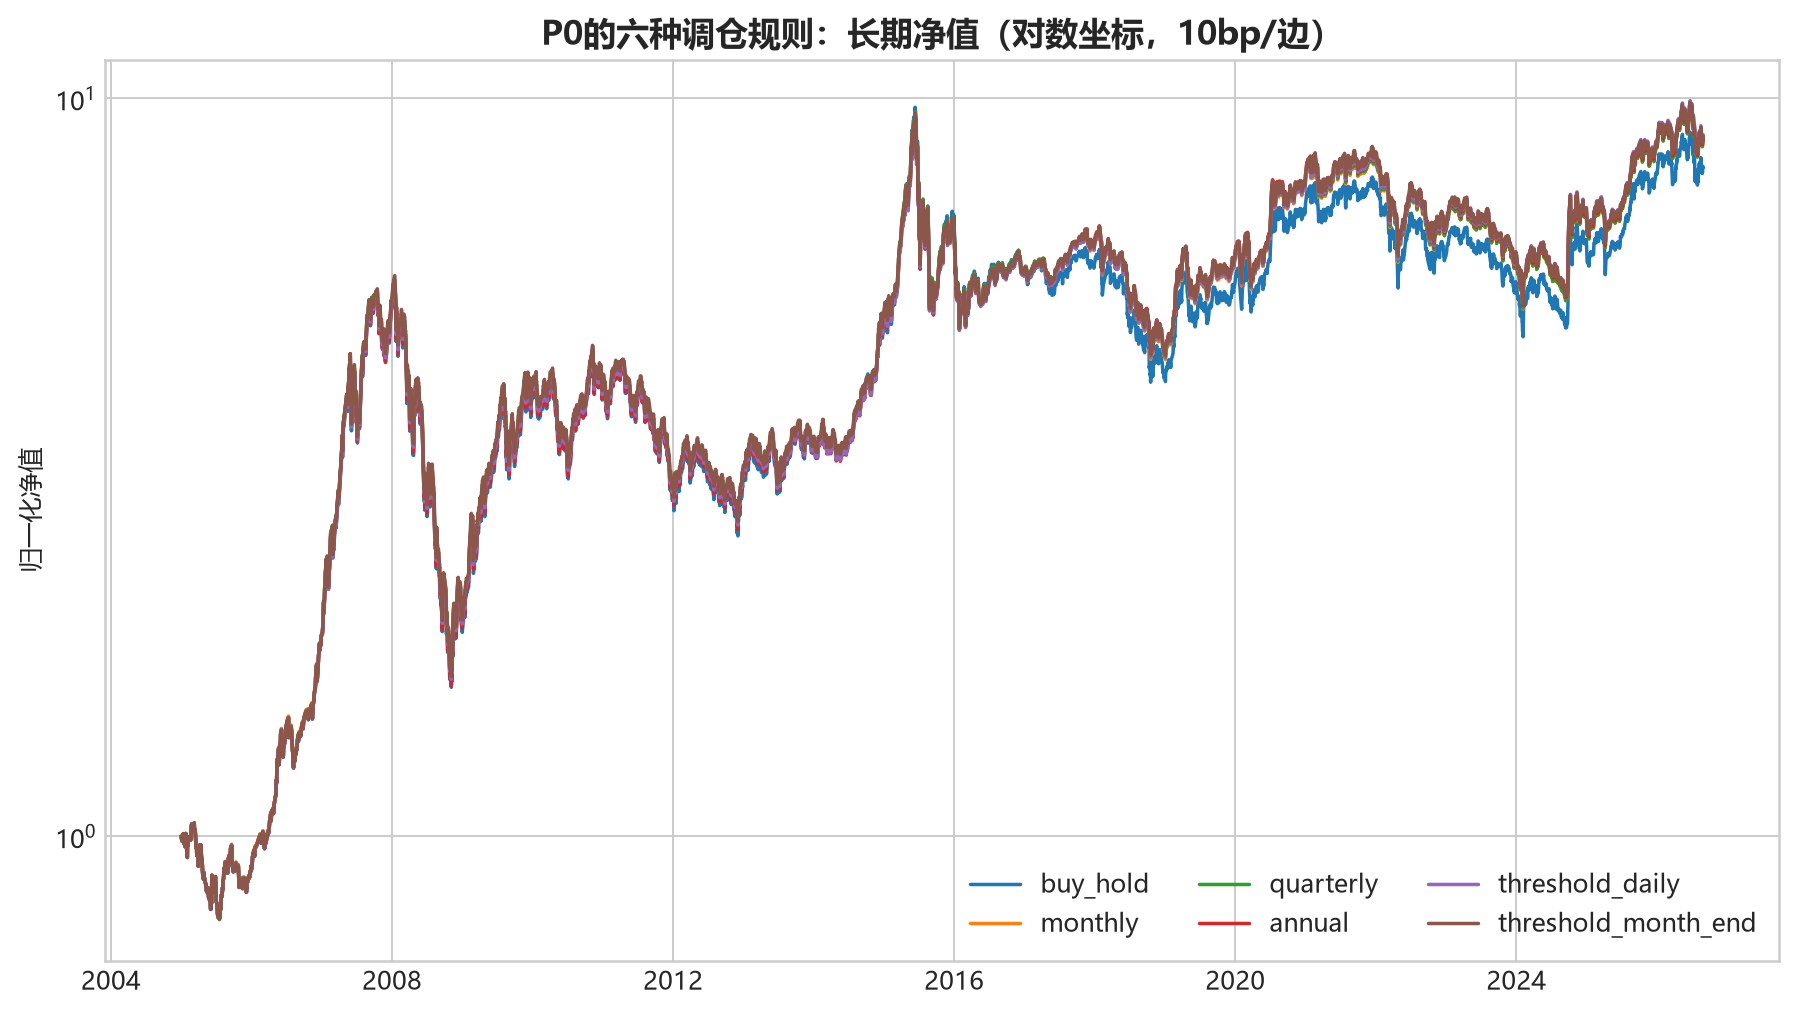
Theoretical total-return indices, 10 bp per side, logarithmic y-axis. Pre-launch CSI A500 history is backcast.
The daily threshold rule has the highest CAGR in this sample and trades less than the quarterly rule. It looks attractive, although checking every day also consumes attention. The month-end threshold rule offers a more practical balance between return and turnover. In absolute return terms, however, the rules are not very different. The remaining experiments therefore use quarterly rebalancing, a simple and transparent convention that is also common among funds.
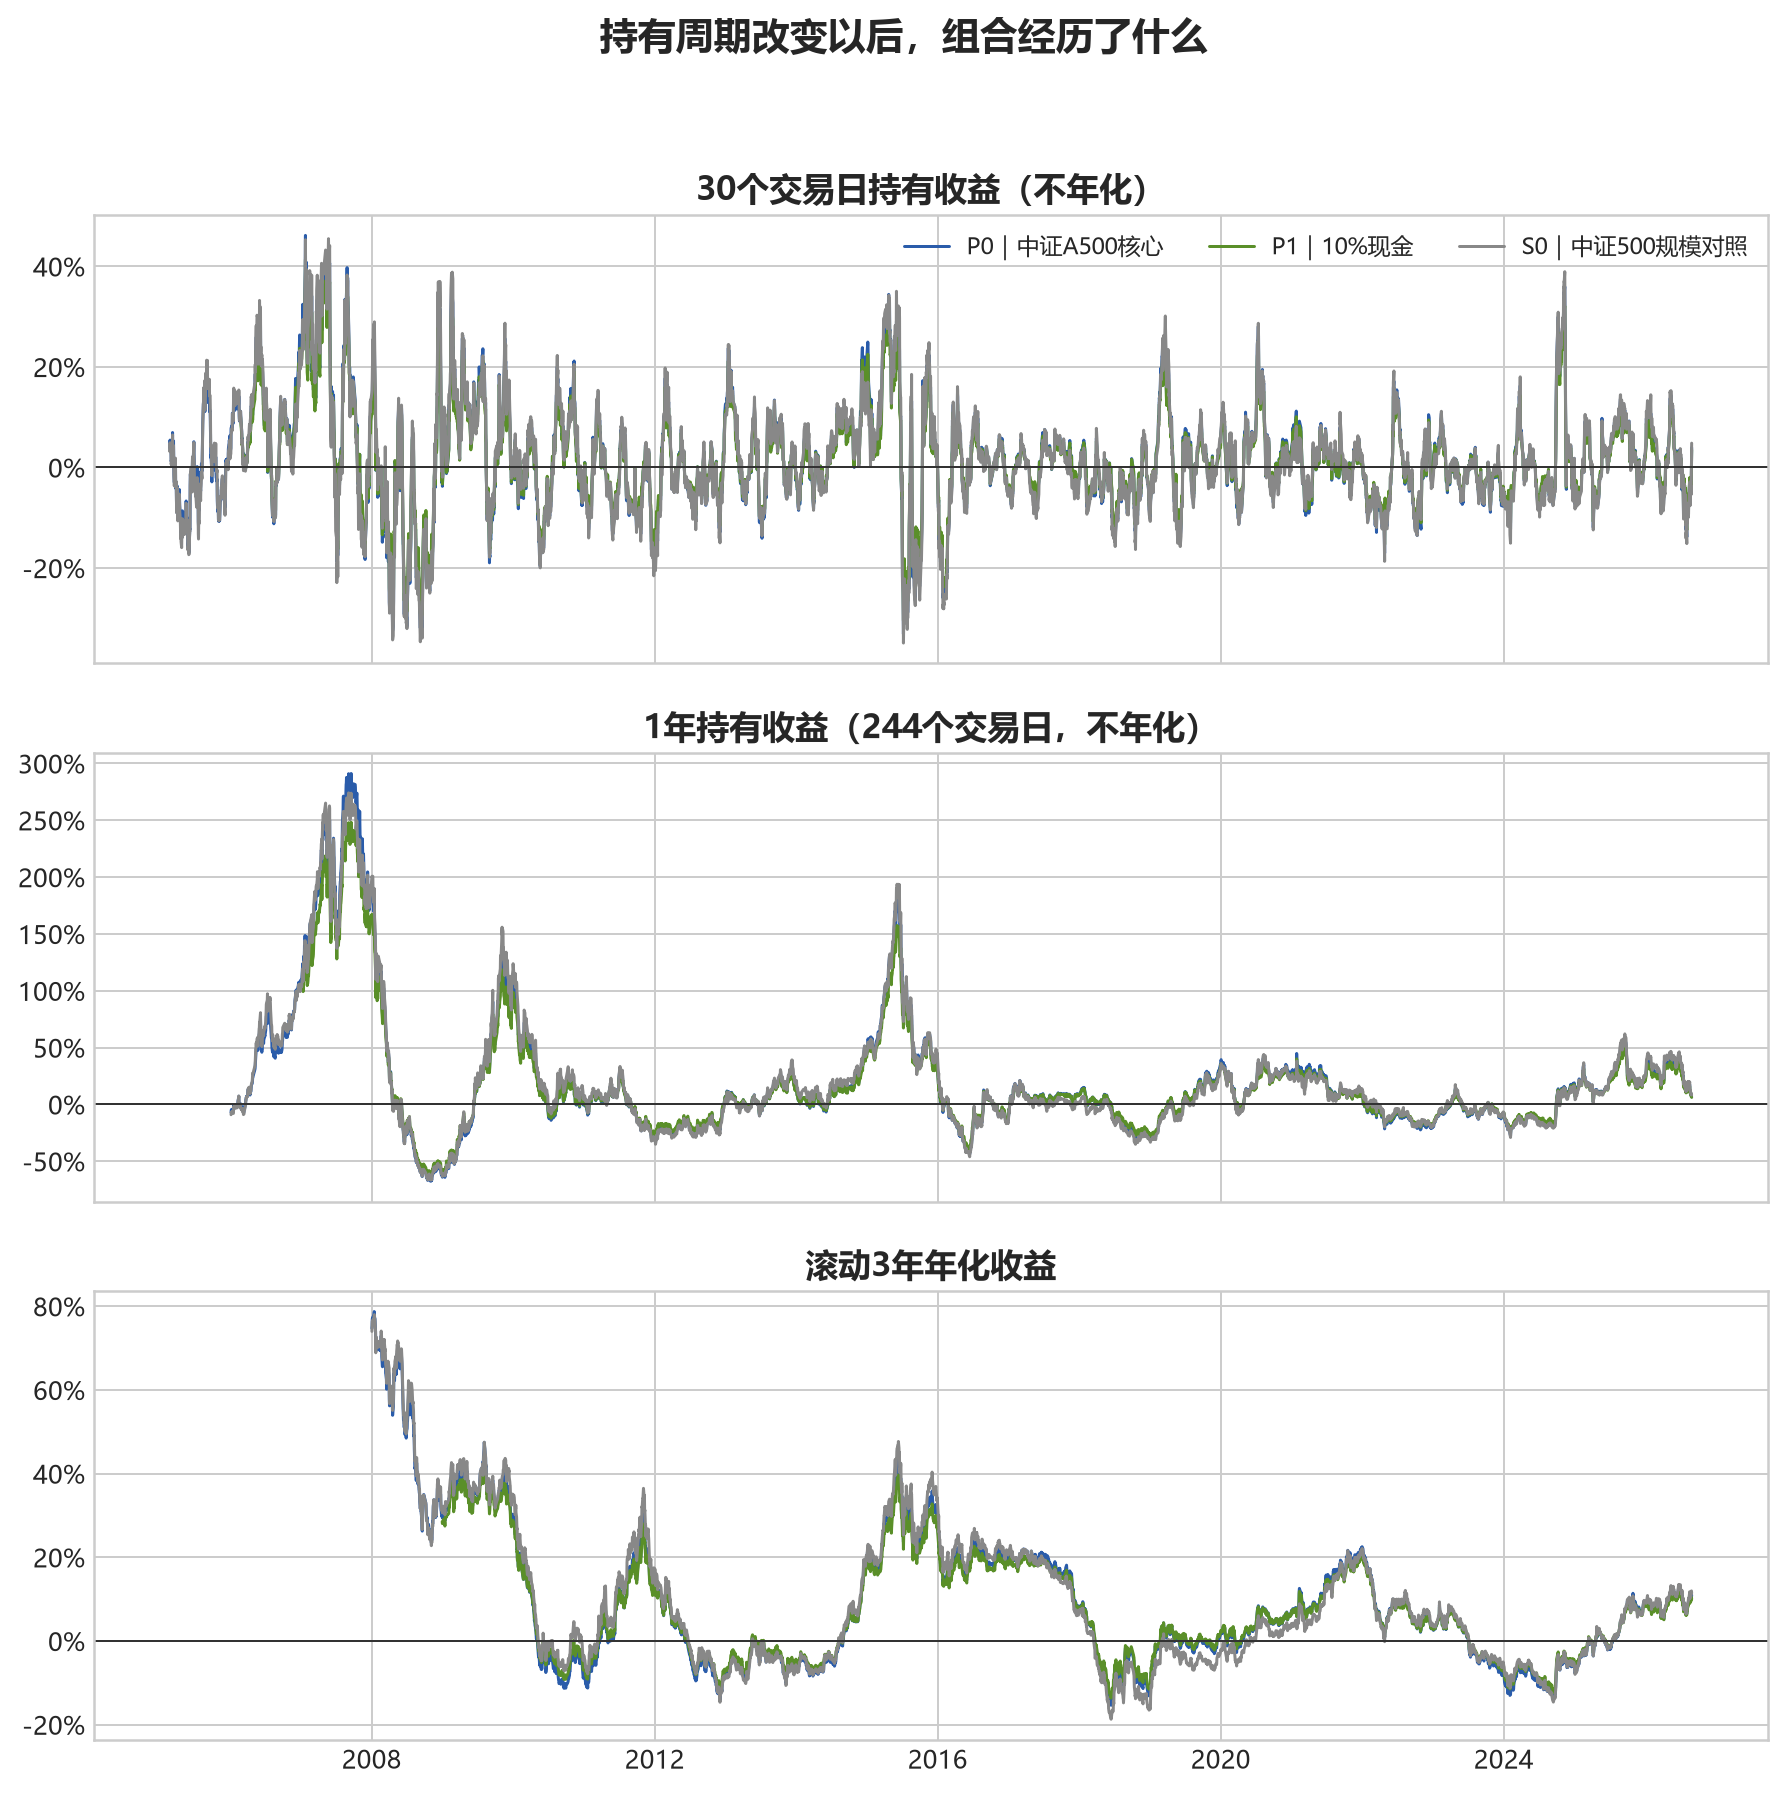
I originally plotted only rolling three-year annualized return. I have now added 30-trading-day and 244-trading-day windows. Annualizing a short window can magnify an ordinary fluctuation into a misleading number, so the 30-day and one-year rows remain realised holding-period returns. Only the three-year row is annualized.
| P0 rolling holding period | Median | 10th percentile | Sample worst | Share of negative windows |
|---|---|---|---|---|
| 30 trading days, not annualized | 1.05% | -9.05% | -33.13% | 44.65% |
| 244 trading days, not annualized | 7.24% | -20.83% | -67.47% | 36.65% |
| 3 years, annualized | 5.85% | -7.50% | -15.37% | 34.37% |
The share of P0 windows with a negative return does decline as the holding period grows, but it never becomes negligible. These rolling windows overlap heavily, so 34.37% should not be read as a loss probability estimated from independent trials. The tails matter more. The worst 30-trading-day window, ending July 8, 2015, lost 33.13%. The worst one-year window, ending October 31, 2008, lost 67.47%. The worst three-year window, ending June 14, 2018, still annualized at -15.37%. A longer investment cycle smooths some short-term noise; it cannot assume the risks of entry timing and equity exposure on the investor’s behalf.
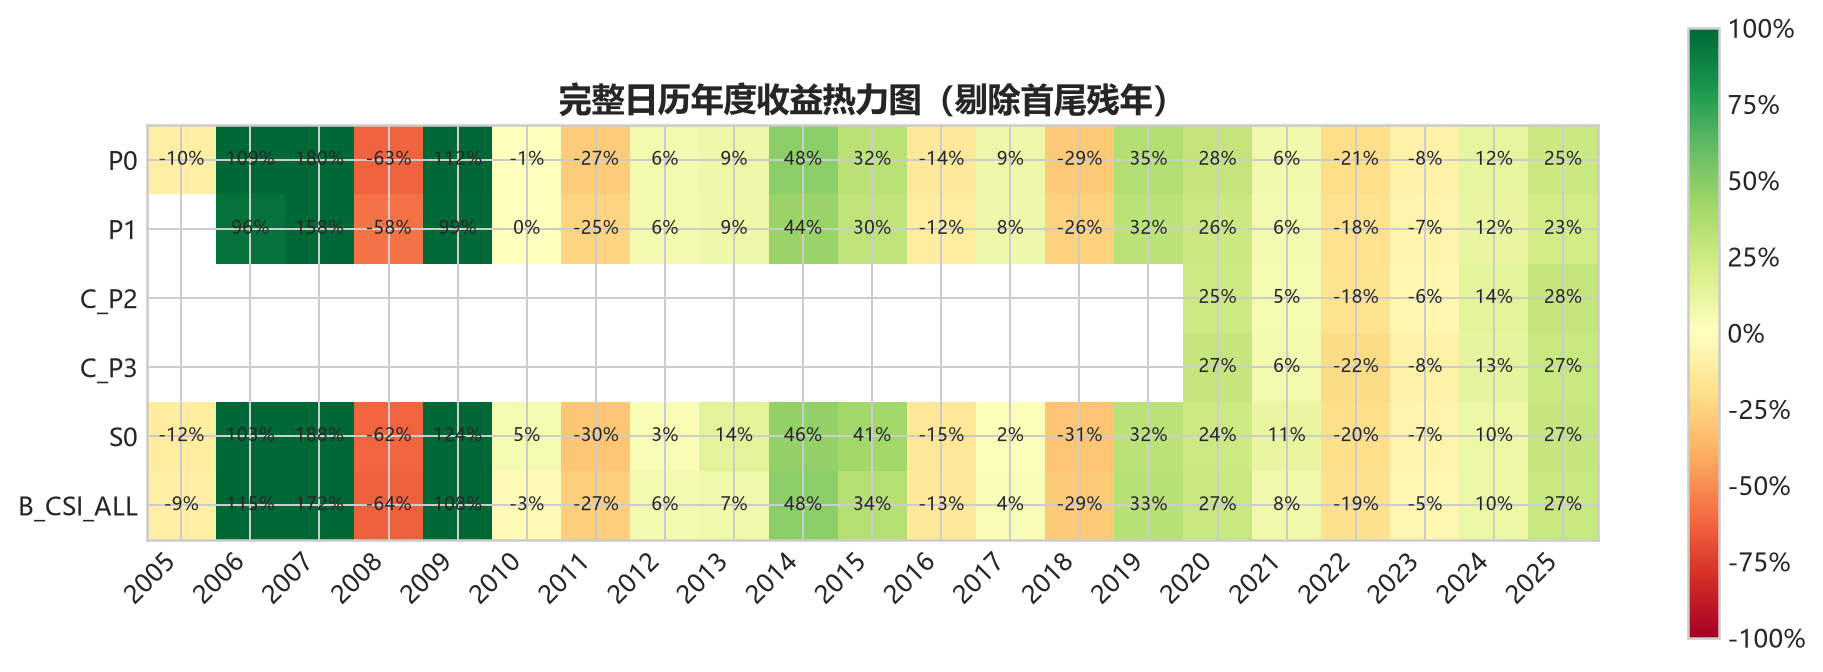
Rolling results use quarterly-rebalanced NAV. The annual heatmap excludes only partial first and last calendar years. Pre-launch CSI A500 history remains backcast.
No matter how often the portfolio rebalances, its long-run maximum drawdown barely changes—and 71% is frighteningly high. More stocks reduce individual-company risk, but they do not turn a nearly 100% A-share equity portfolio into a low-risk asset. Market, liquidity, and valuation cycles remain dominant. Concentrating the initial purchase near a high can still turn a one-off investment into a very long lock-in.
P0 uses the CSI A500; only S0 uses the CSI 500. The CSI 500 size-segment control S0 has a 10.80% long-run quarterly CAGR, 26.63% annual volatility, and a -71.90% maximum drawdown. The CSI A500 core P0 records 10.53%, 25.37%, and -71.31%. Moving from S0’s CSI 500 structure to P0’s CSI A500 structure reduces sample volatility by about 1.25 percentage points, gives up about 0.28 points of CAGR, and modestly improves drawdown. None of these differences is statistically significant. The backcast CSI A500 total-return series alone has a 10.28% CAGR, 24.65% volatility, and a -70.65% maximum drawdown. P0 earns a little more while also taking a little more risk. It remains a trade-off.
Trading costs matter less than I expected. Raising P0 quarterly costs from 0 to 20 bp lowers CAGR from 10.55% to 10.51% because turnover is modest. The theoretical layer does not include minimum commissions for small accounts, bid-ask spreads, round-lot constraints, or intraday impact, so real execution may be less forgiving.
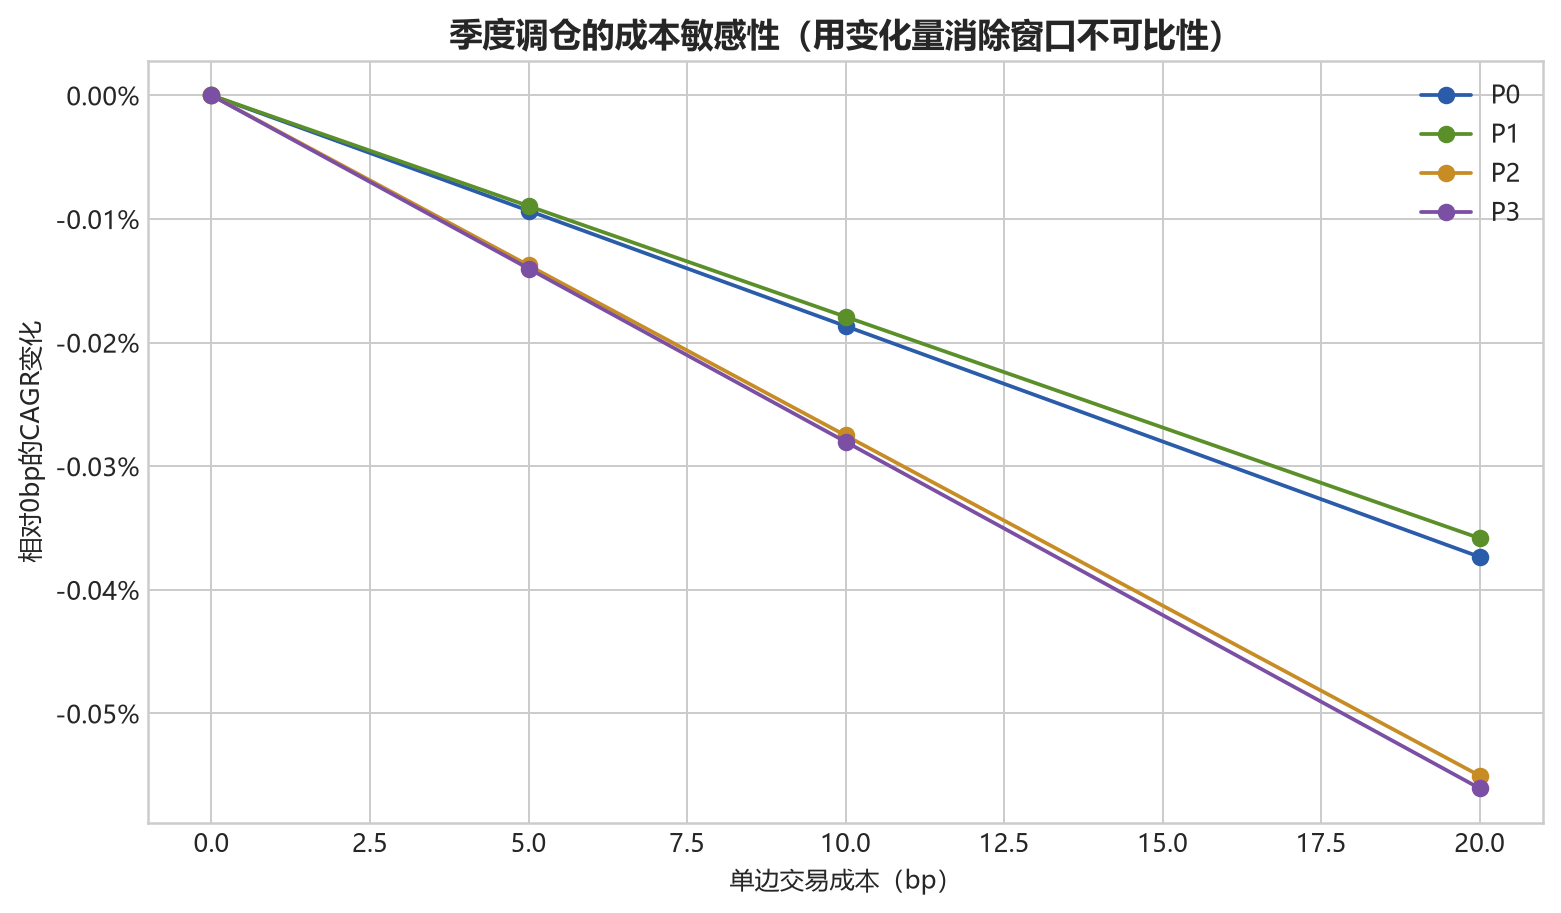
The narrow, main, and wide threshold bands do not produce a neat monotonic pattern either. The main band happens to look better in the sample, the narrow band trades more, and the wide band drifts more; the differences remain small.
Three more background boards: dividend, CSI 300, and CSI 2000
P0 and S0 alone still do not show where this core sits next to more familiar style and size indices. I therefore place P0 beside the CSI Dividend Index, CSI 300, and CSI 2000, rebuilding every path from the CSI 2000 base date of December 31, 2013 through August 28, 2026. P0 remains the equal-weight CSI 300, CSI A500, and CSI 1000 core with quarterly rebalancing. The three single-index paths are buy and hold. All four include the same 10 bp initial transaction cost.
| Common-window background | CAGR | Annual volatility | Max drawdown | Calmar |
|---|---|---|---|---|
| P0, CSI A500 core | 7.66% | 21.95% | -53.56% | 0.143 |
| CSI Dividend total return | 12.21% | 20.13% | -45.66% | 0.267 |
| CSI 300 total return | 7.99% | 21.02% | -46.06% | 0.173 |
| CSI 2000 total return | 10.26% | 27.69% | -67.35% | 0.152 |
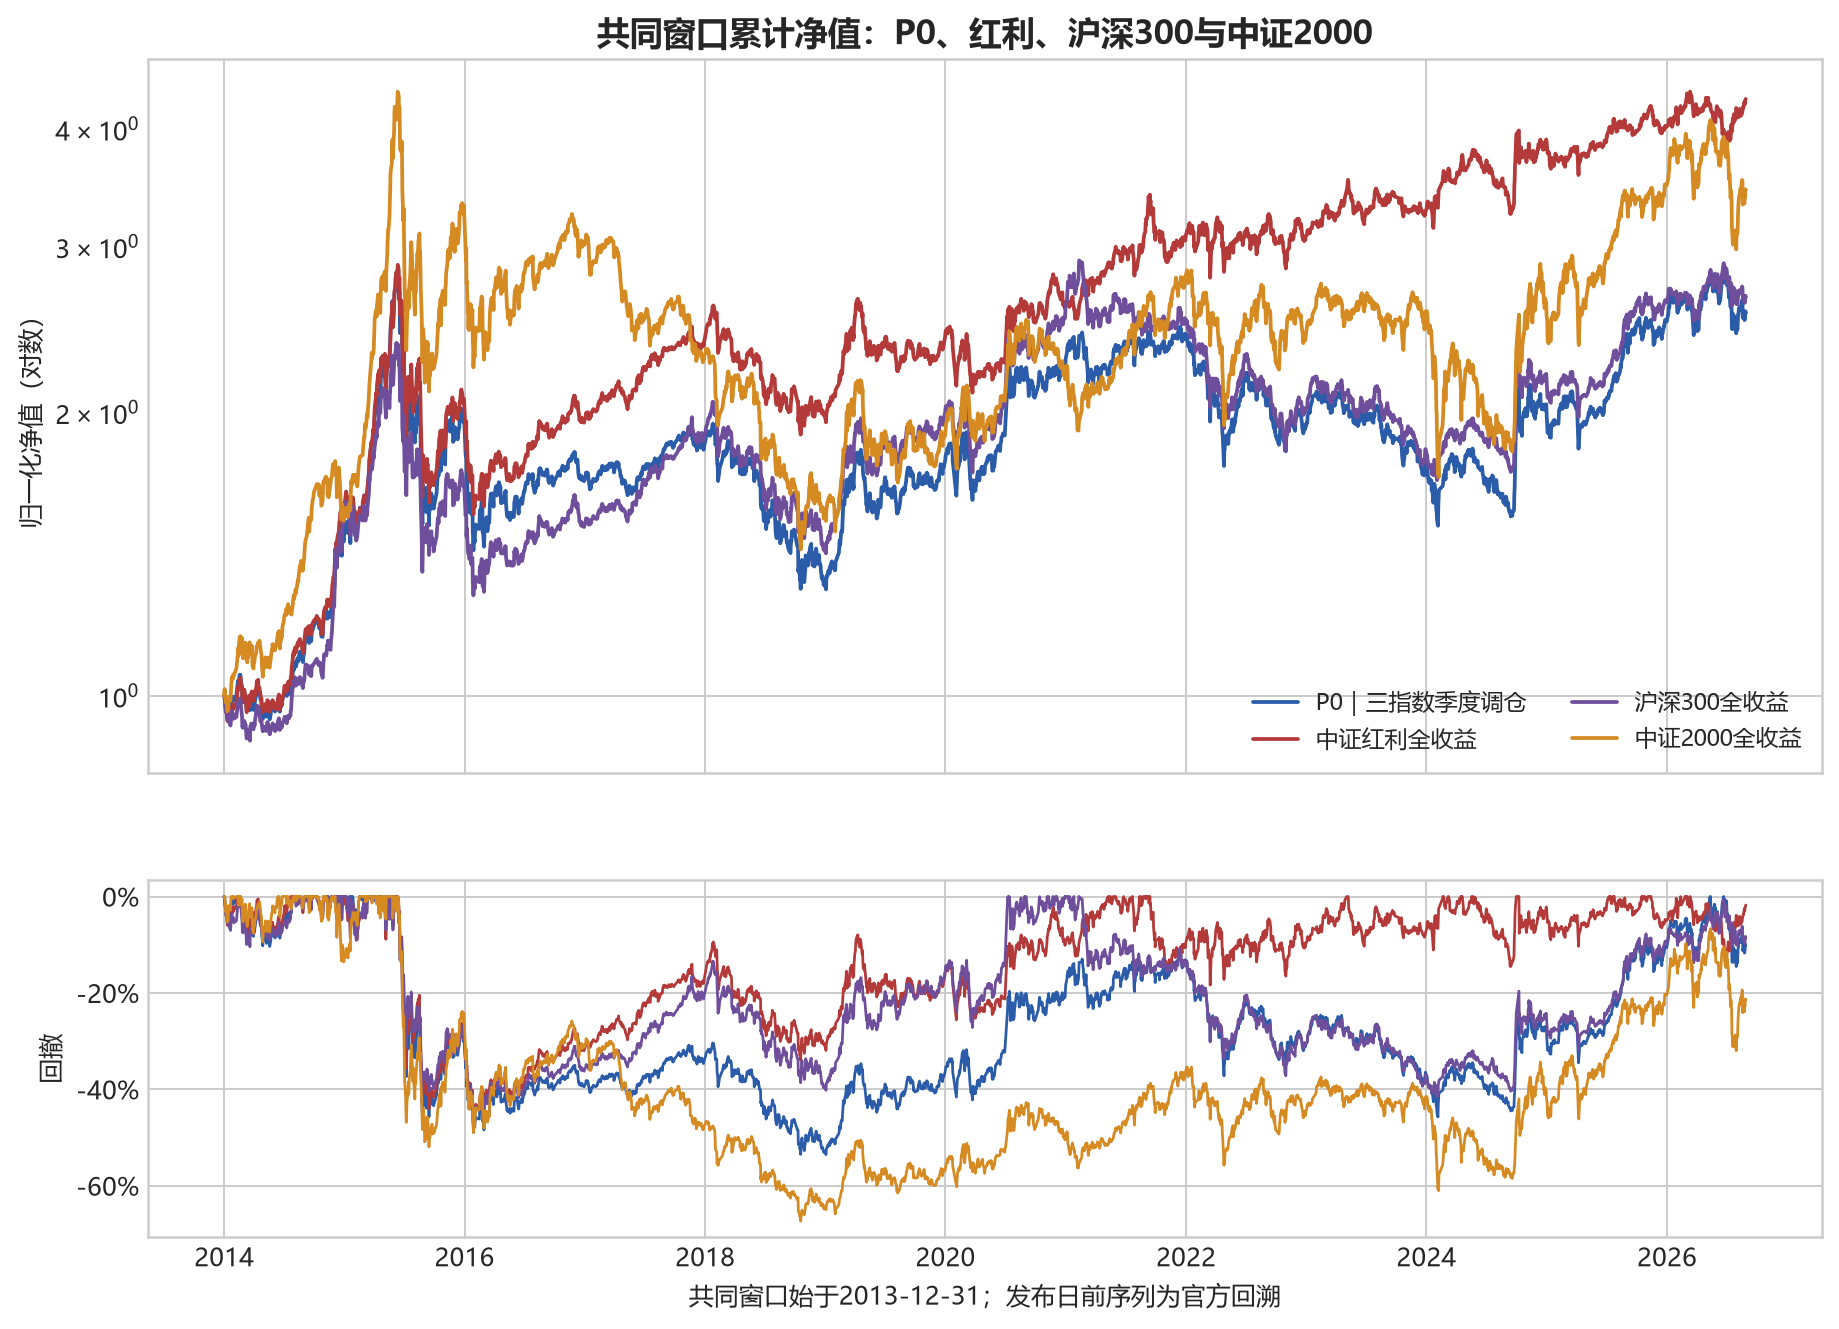
In this sample, CSI Dividend has the highest return and the lowest volatility and drawdown. P0 does not beat the CSI 300 and also draws down further. CSI 2000 has a higher CAGR than P0, but it also produces the highest volatility and deepest drawdown. On this background board, smaller-cap exposure is not free diversification. The help from the dividend index is better understood as the realised return of a distinct high-dividend style in this period, not as a promise that the same style will lead in the next one.
Cumulative NAV makes the terminal difference easy to see, but it is sensitive to the chosen start and end dates. I therefore repeat the earlier 30-trading-day, 244-trading-day, and three-year tests on these four common-window paths. The 30-day and 244-day panels show realised holding-period returns; only the three-year panel is annualised.
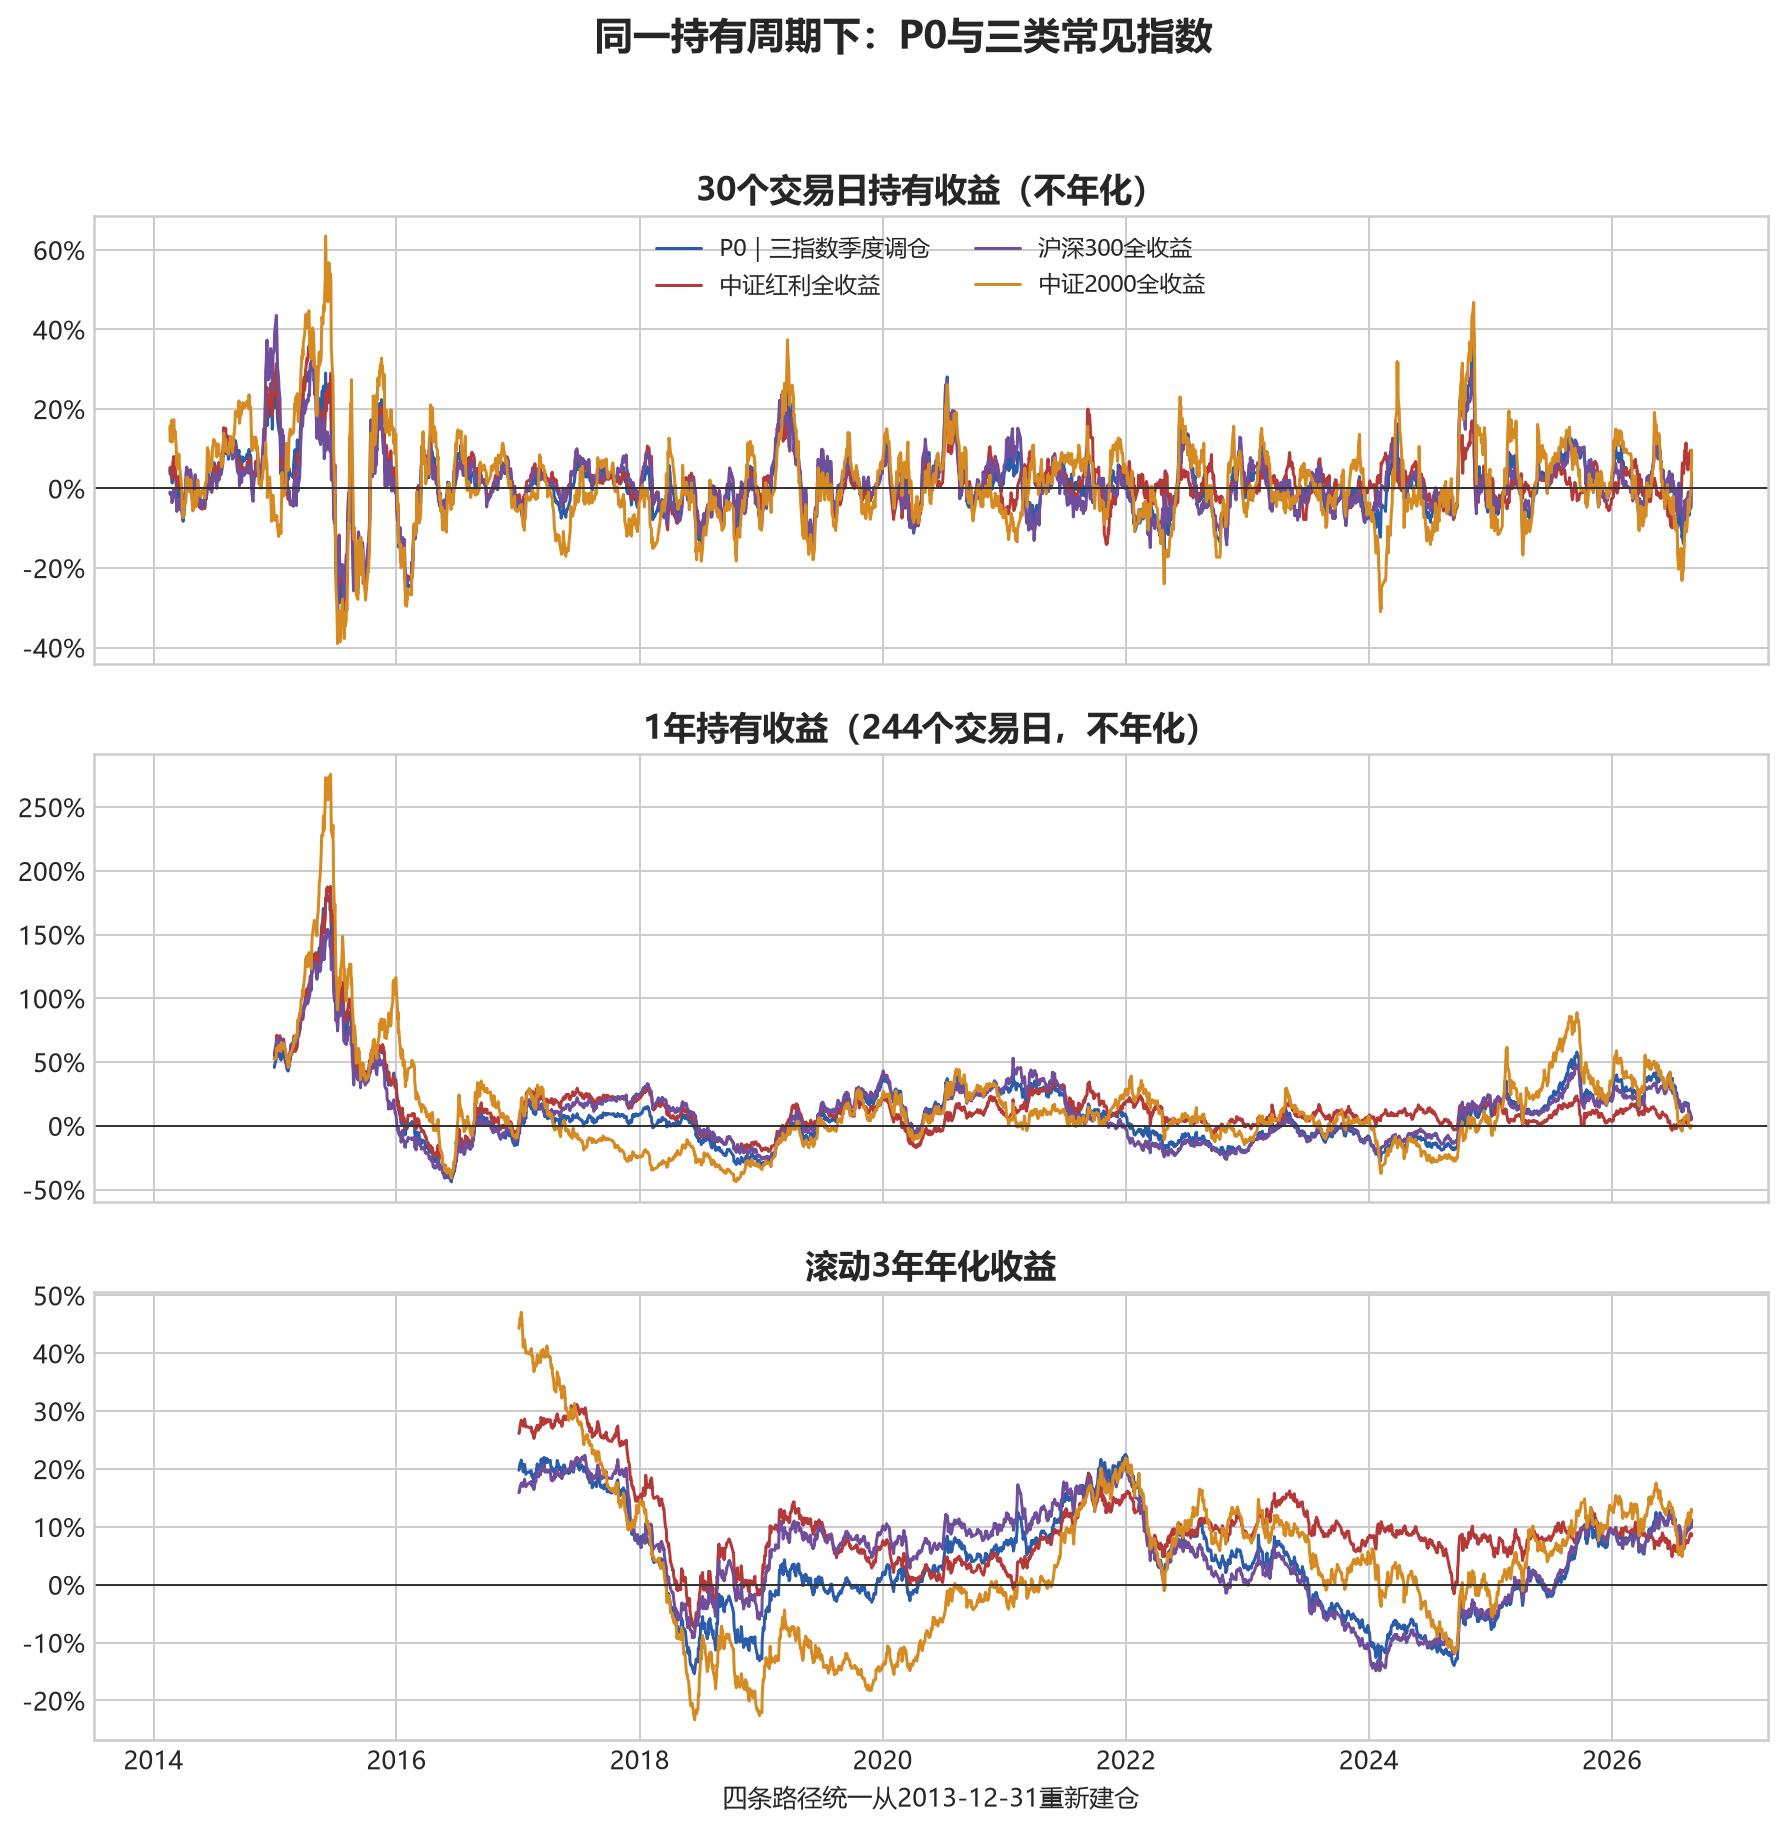
| Common-window path | 30 days: median / negative windows | 244 days: median / negative windows | 3-year annualised: median / negative windows |
|---|---|---|---|
| P0, CSI A500 core | 0.92% / 44.16% | 6.77% / 37.83% | 3.80% / 34.83% |
| CSI Dividend total return | 1.38% / 38.00% | 9.92% / 16.93% | 8.61% / 3.75% |
| CSI 300 total return | 0.81% / 44.72% | 10.81% / 38.58% | 6.74% / 26.81% |
| CSI 2000 total return | 0.33% / 48.59% | 6.13% / 35.79% | 3.66% / 38.53% |
Over 30 trading days, all four paths frequently fall below zero. CSI 2000 does so in nearly half of the windows, while even CSI Dividend records 38.00%. At 244 trading days, CSI 300 has the highest median return, but 38.58% of its windows are negative. CSI Dividend has a slightly lower median and a much smaller negative-window share of 16.93%. The median alone misses that difference.
At three years, CSI Dividend records an 8.61% median annualised return and only 3.75% negative windows in this sample. P0 records 3.80% and 34.83%, while CSI 2000 records 3.66% and 38.53%. Combining the three indices does not create a smoother holding experience than these familiar indices in this common window. All rolling windows overlap heavily, so the negative-window share is a sample description rather than a loss probability estimated from independent trials. The robustness section therefore uses a paired block bootstrap to preserve the time dependence in return ordering.
The dates still matter. CSI Dividend was launched in 2008, so this common window is entirely post-launch for that index. CSI 2000 was not launched until August 11, 2023, and CSI A500 not until September 23, 2024; their earlier curves are official backcasts. The boards show what happened in this historical sample. They do not rank future returns.
The remaining 10%: cash, gold, or STAR 50
The satellites are comparable only on the same window. The pre-registered window runs from January 2, 2020 through August 28, 2026, with quarterly rebalancing and 10 bp per side:
| Portfolio | CAGR | Annual volatility | Max drawdown | Calmar | Change relative to P0 |
|---|---|---|---|---|---|
| P0, no satellite | 5.30% | 20.00% | -38.55% | 0.137 | Baseline |
| P1, 10% cash | 5.12% | 17.98% | -34.93% | 0.146 | Return -0.18 pp, lower risk |
| P2, 10% gold | 6.73% | 18.30% | -33.34% | 0.202 | Better sample return and risk |
| P3, 10% STAR 50 | 5.88% | 20.81% | -40.06% | 0.147 | Higher return and higher risk |
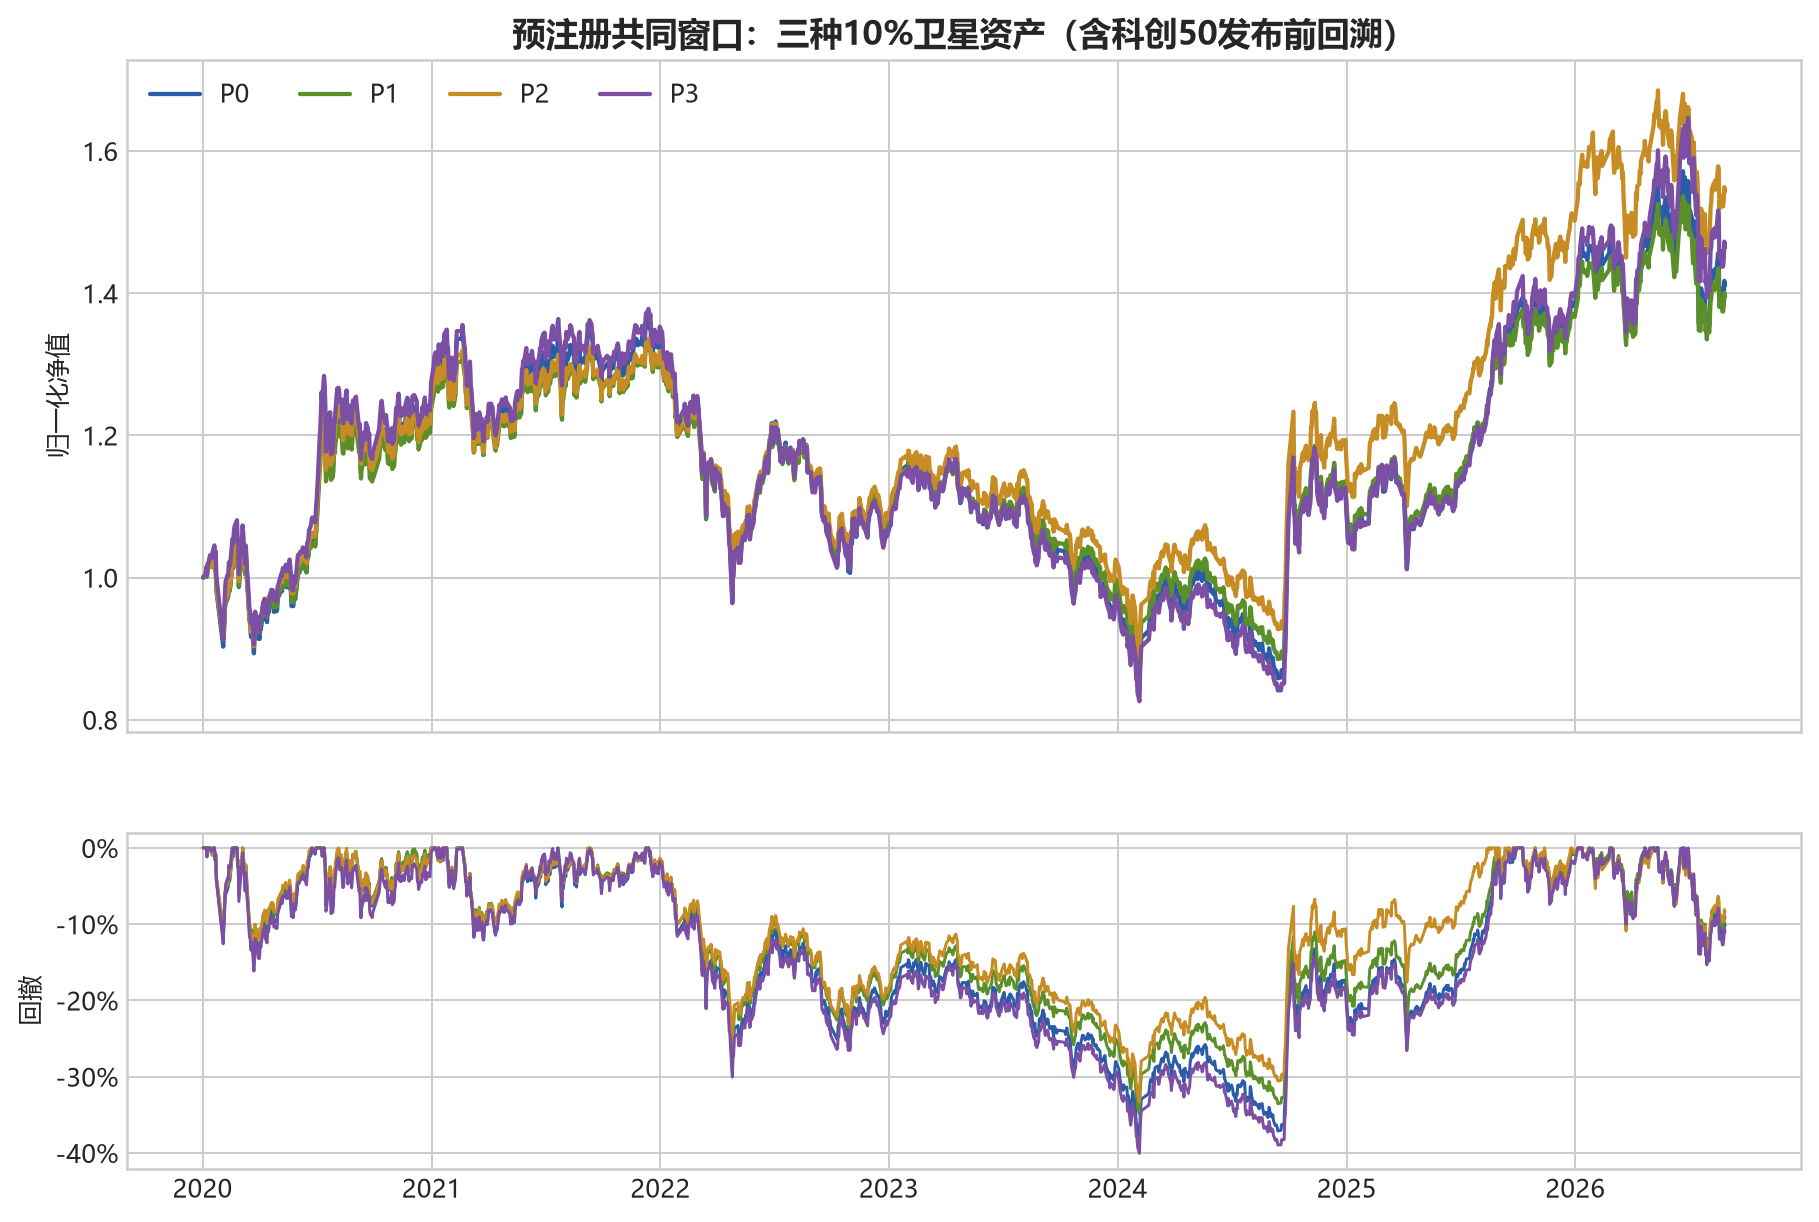
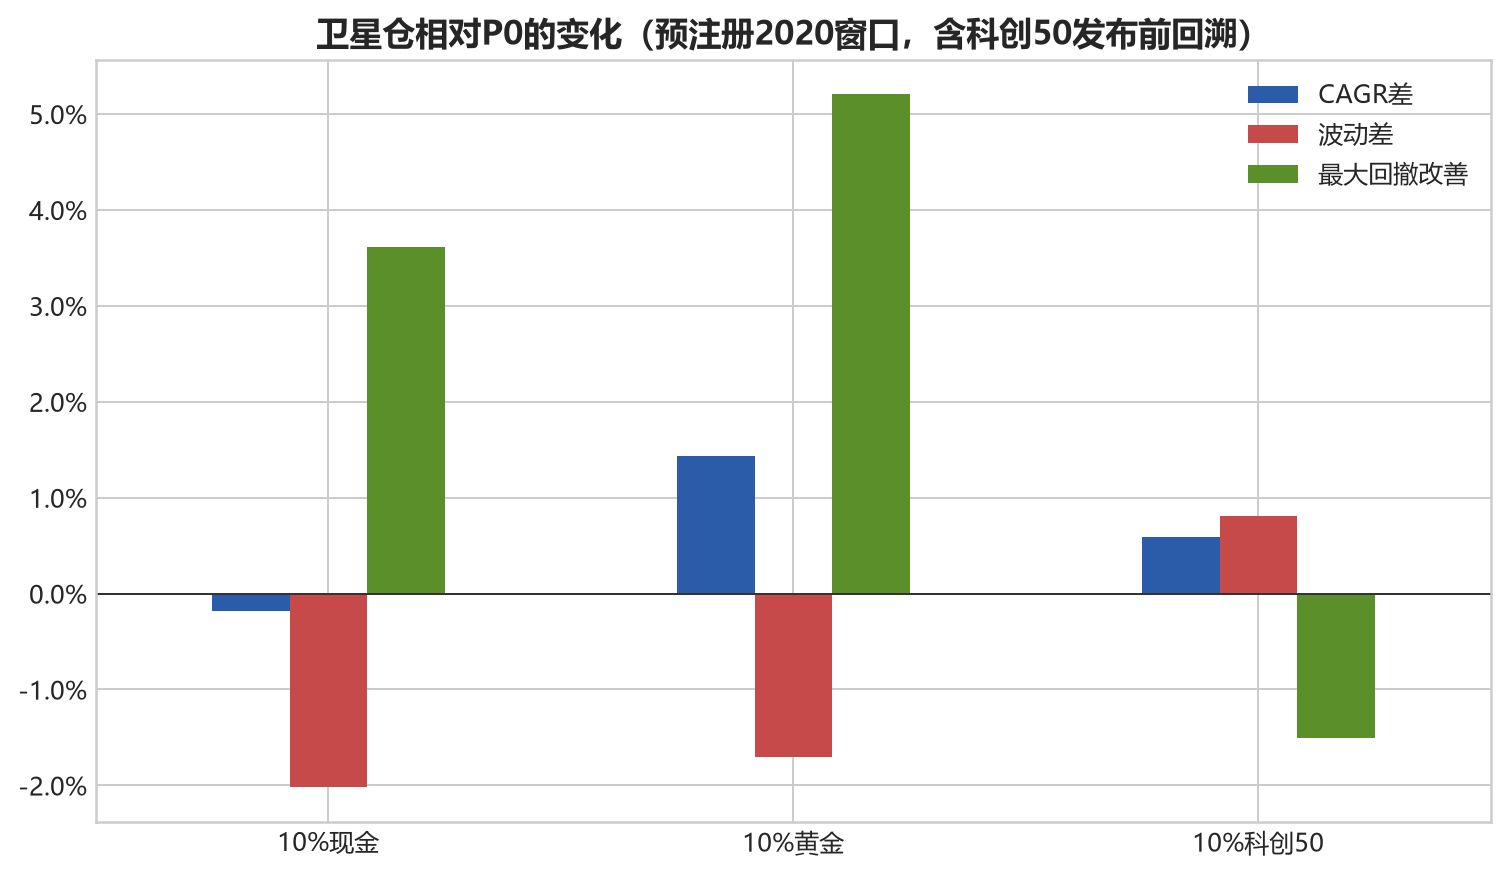
Cash gives up 0.18 percentage points of sample CAGR in exchange for 2.02 points less volatility and a 3.62-point improvement in drawdown. In the 20-day block results, the Calmar and drawdown improvement intervals are positive, while CAGR and Sharpe cross zero. Cash is simply reducing equity exposure: the defensive effect is visible, but return enhancement is not.
Gold looks best in this period. Relative to P0, it adds 1.43 percentage points of CAGR, reduces volatility by 1.71 points, and improves maximum drawdown by 5.21 points. The Sharpe, Calmar, and drawdown intervals are positive, while the 95% CAGR-difference interval still spans -0.39 to 2.96 percentage points. The fair statement is that gold diversified this period. The evidence is not strong enough to turn that into a claim that gold must raise long-run return.
A simpler benchmark also warns against assigning credit to the wrong component. A 90% CSI All Share plus 10% gold portfolio has a 7.23% CAGR and -31.99% maximum drawdown, slightly better than P2 at 6.73% and -33.34%. The difference has no statistical support. Most of the visible help comes from gold itself, not from an independent alpha generated by the three-index core.
The STAR 50 is a different proposition. It adds 0.59 percentage points of CAGR and 0.81 points of volatility while worsening maximum drawdown by 1.51 points. Every bootstrap interval crosses zero. Adding it can express a preference for growth and technology; it should not be called defensive diversification.
There is also a STAR 50 launch-date issue. Moving the starting date from the pre-registered January 2, 2020 to the formal July 23, 2020 launch changes the CAGRs of P0, cash, gold, and STAR 50 to 2.60%, 2.67%, 4.10%, and 2.85%. Maximum drawdowns remain -38.55%, -34.93%, -33.34%, and -40.06%. Cash moves from trailing P0 by 0.18 points to leading it by 0.07 points, a reminder that point estimates in short windows are unstable. Gold still improves risk and STAR 50 still increases it.
Dynamic cash did not become risk control
The dynamic rule uses a zero-cost, quarterly equal-weighted three-index core as its reference. When the reference first crosses drawdowns of 10%, 20%, and 30%, the cash target falls from 10% to 7%, 4%, and 0%. Cash returns to 10% only when the reference NAV recovers to within 5% of its previous high. Within one drawdown cycle, cash can only be spent. A partial rebound does not refill it.
That sounds like risk control, but the trade itself is to buy more as the market falls. If the market keeps falling after cash is deployed, the portfolio approaches full equity exposure at the riskiest point. Rebuilding cash near the previous high then requires selling some equity. The rule may increase participation in a rebound; that is not the same as reducing losses.
| Rule | CAGR | Volatility | Daily 95% ES | Max drawdown | Calmar | Annual turnover |
|---|---|---|---|---|---|---|
| Static 10% cash | 11.17% | 22.92% | -3.76% | -66.81% | 0.167 | 15.77% |
| Dynamic 10/20/30 | 11.02% | 25.02% | -4.10% | -70.54% | 0.156 | 21.66% |
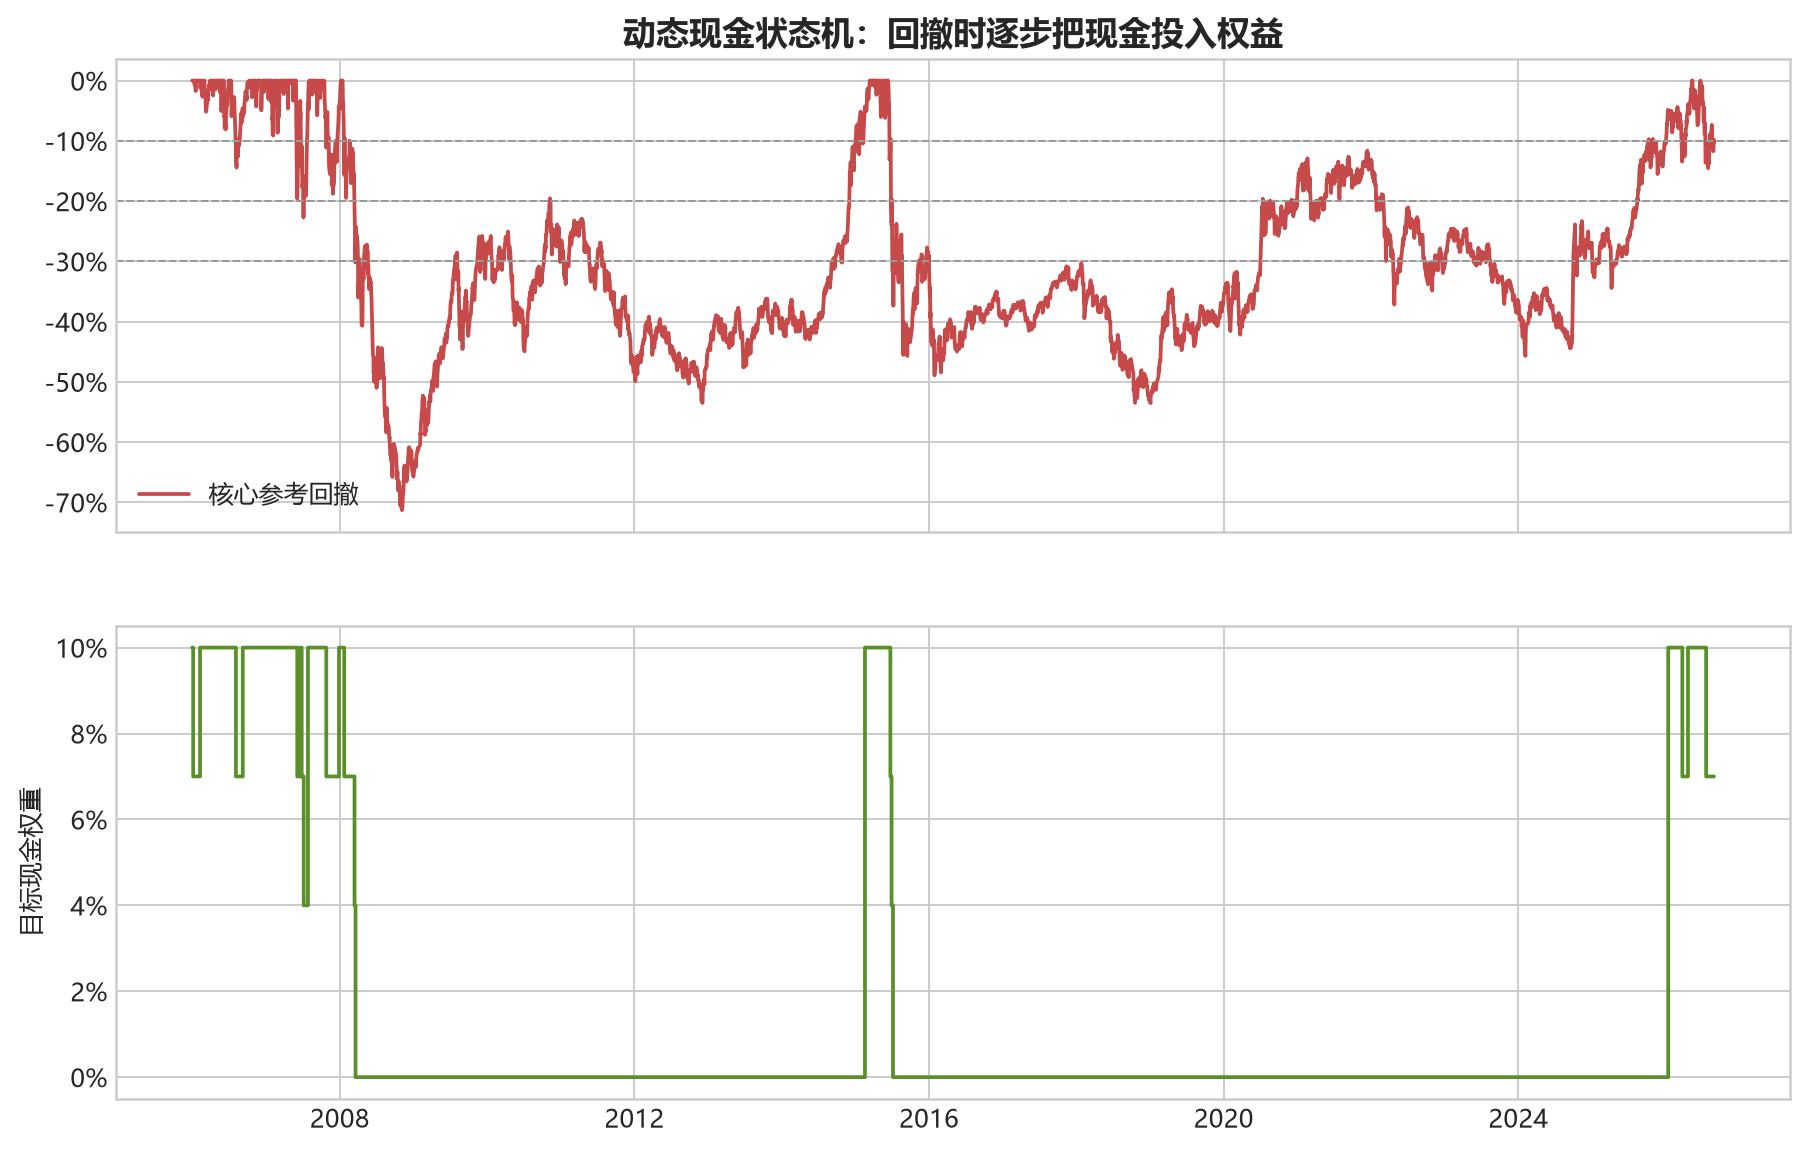
Cash only declines within a drawdown cycle and resets after recovery to within 5% of the high.
The main dynamic rule fails the success condition fixed in advance. Drawdown and ES worsen, Calmar falls, and CAGR loses about 0.15 percentage points. The 20-day block 95% interval for its maximum-drawdown difference relative to static cash runs from -6.68 to -1.74 percentage points, and the Calmar interval is also below zero. Earlier 8/16/24% or later 12/24/36% triggers do not reverse the direction.
I would therefore no longer call this dynamic risk control. It is a buy-the-dip rule. Whether buying after a decline improves future returns and whether it reduces current losses are two separate questions.
How I interpret the portfolio now
If I wanted an A-share core that is easy to maintain, I would begin with quarterly rebalancing. Threshold rebalancing is also reasonable and happens to trade less with a slightly higher sample return, but the difference is not statistically confirmed. The practical choice returns to actual account fees, how often I am willing to check the portfolio, and how much weight drift I can tolerate.
If drawdown matters more, static cash is clearer than this dynamic cash rule: hold less risk and accept the corresponding opportunity cost. Gold diversified the post-2020 sample more effectively, but it has its own price cycle. The Au99.99 theoretical layer does not include ETF fees, custody costs, or gold-lending income. I would not extend the result from these years directly into the future.
The STAR 50 expresses a different risk preference. It makes the portfolio more tilted toward technology, growth, and high volatility. It may add upside sensitivity and may also deepen drawdowns. Different constituents do not automatically mean better risk diversification.
Returning to the original question, a CSI 300/CSI A500/CSI 1000 mix remains a nearly all-equity A-share portfolio. The CSI A500 and CSI 300 overlap heavily. The CSI 1000 broadens stock coverage but does not create a cross-asset source of risk. The CSI 2000 background board reinforces the point: adding still more small-cap stocks can also bring higher volatility and a deeper drawdown. Cash and gold, rather than another differently named equity index, are what materially change the drawdown structure.
I began hoping to find one clear rebalancing answer. What remains is a set of trade-offs: quarterly is easy to maintain, thresholds reduce unnecessary trades, cash defends, gold diversifies in this sample, STAR 50 attacks, and the dynamic cash rule did not work. Keeping the positive, negative, and statistically inconclusive results together is closer to the actual portfolio than preserving only the highest cell in a backtest table.
Data and references
- Title: Does a 30/30/30+10 Portfolio Really Diversify China A-Shares?
- Author: Hyacehila
- Created at : 2026-08-28 14:00:00
- Link: https://hyacehila.github.io//blog/2026/08/28/a-share-300-a500-1000-rebalancing/
- License: This work is licensed under CC BY-NC-SA 4.0.